
Data Analytics with Tableau 2021
It is rightly pointed out by “Gartner”, global research and advisory firm that, “Tableau is the best product in all over the world itself.” Let us understand what is Tableau.
What is Tableau?
“Tableau” is a business intelligence tool that helps us to analyse data in a visual manner. It may be big data, maybe cloud data or any other data, that can be used via this software. It has been started in 2003 by Pat Hanrahan, Christian Chabot and Chris Stolte.
About Tableau
Data analysis should be about asking questions and not about learning software, and that is what believed by Tableau. With built-in visual best practices, it provides limitless data exploration without interrupting your flow of analysis.
Specifically, it is divided into five different tools.
a) Tableau Desktop
b) Tableau Online
c) Tableau Server
d) Tableau Reader
e) Tableau Public
Tableau Desktop and Tableau Online are being used to create reports whereas the other three tools are being used for the publication of reports. It can be used by authorities and staff for the observation purpose of the report which is made.
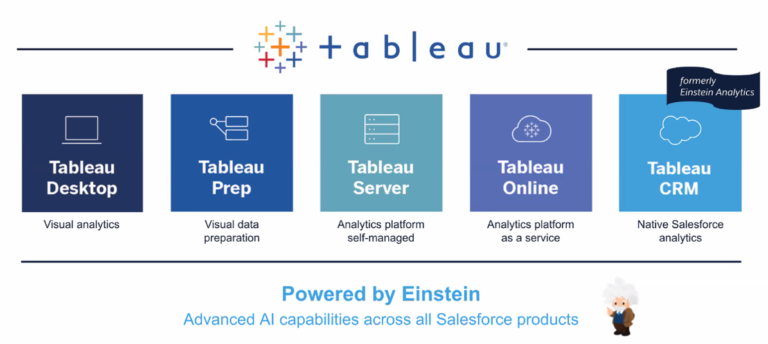
Tableau has very good compatibility with different types of databases. It can be connected to spreadsheets, databases, big data, cloud applications and other important applications as well. The most interesting fact is, it can be supported by desktop, tablet and mobile phone systems and works actively. As a result, anyone can access it easily.
Using data via Tableau
Tableau database has specifically two parts.
a) Dimension
b) Measures
The texts, dates, geographical things can be included in the Dimension part whereas the numbers, figures and all calculated fields can be used in the Measures part.
Interesting to observe that, around twenty-four types of charts, E.g.: Bar charts, Pie charts, Line Charts, World Maps, TreeMaps, Line Charts etc. are supported by Tableau.
Why should we use
The last most important question, we ask,
Why Tableau?
1. Tableau has a great speed of working software where any chart or data can be actively done in only 30 seconds to 60 seconds.
2. Tableau is user-friendly and worthy enough for a common man.
3. Tableau consists of a beautiful and interactive dashboard, which is fantastic to use.
4. Tableau persists in its direct connection with multiple databases which comforts the user to access other software and platforms easily along with its application.
5. Tableau has an easy publishing and sharing system, via which it can be shared and accessed by anyone all over the world.
6. Lastly, it has a vast and incredible growing market which helps us to grow our business and plans.
So, now, we should say,
“Yes, it is the best and we should learn it.”
So, let us give a kickstart. Today and now.
Don’t have an idea? Want to learn?
Don’t worry. We are with you to help you out. Join our webinar and learn about the application.
Link:
https://bit.ly/OretesTableauWEBINAR
Register yourself, be a part of us.


Leave a Reply